Give Us 24 Hours, and We’ll Save You Thousands in Battery Capacity
Shortening a system’s payback time is one of our top priorities when designing a solar solution for clients who want to leverage our Grid-as-Backup concept to lower electricity bills and boost resiliency.
After all, our goal is to make the solution pay for itself within 2 to 3 years, not 10 to 15. It means spending every penny strategically to maximize the benefits of solar.
Since battery is typically the most expensive component, we start from there.
If we were to provide cookie-cutter solutions, we could shove the same number of battery units to each client — sure, they won’t run out of power at night, but that’s just because they’re overpaying for battery capacity by thousands of dollars.
That’s not how we roll.
We measure each client’s nighttime usage pattern and power requirements to calculate exactly how much battery capacity they need to maximize their investment.
But how?
While electricity bills show you how much power you consume in a month, SCE doesn’t provide the transparency you need to understand your consumption pattern and make an informed decision.
How about going around the house and asking the client which appliances they use at night?
The power consumption of an appliance depends on its model, make, and age. A 15-year-old fridge can use three times as much power as a modern, energy-efficient one of similar size and capacity. Also, it’s easy to overlook things that quietly run in the background (e.g., Starlink, well pump, whatever you left plugged in the garage).
So, we designed and built a nifty little device (you can’t find it anywhere else!) to measure current, voltage, and energy consumption to help us get the exact number — allowing our clients to find out how much battery capacity they need and how to adjust their consumption patterns to lower costs without impacting their quality of life.
Work in progress: Building the data collector and setting up the reporting.
All we need to do is put the clamp around the wire in the client’s electric panel and leave it there for at least 24 hours. The client goes about their day as usual, and the device will collect data in the background without interruptions.
We may also work with the client to run some heavy loads to understand how they impact power consumption. For example, if a client wants to have enough battery capacity to use the A/C for a few hours after sunset in the summer, but we’re doing the measurement in the fall, we may have them run the A/C briefly to gauge the effect.
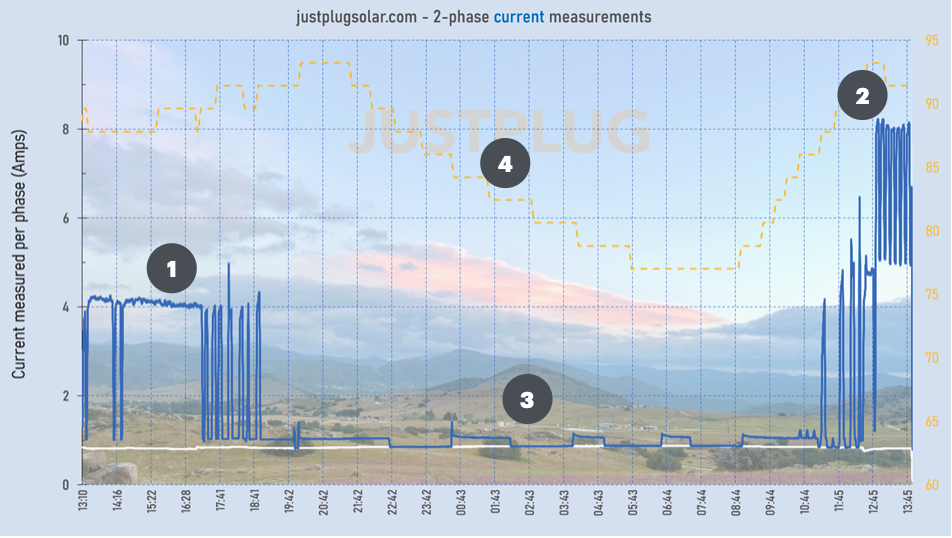
At the end of the data collection period, the software will generate three graphs to show current, voltage, and energy consumption measurements. The example below was an experiment where we ran two A/Cs and a small fridge in the workshop.
The graph below shows the current measurements:
One A/C was running.
The second A/C kicked in, bringing maximum power consumption to 8 Amps (over 1,000W).
The A/Cs were off, and the fridge went on and off during the night.
The orange line shows the temperature in the data collector (close to ambient temperature).
What we learned: This setup requires a 2,000W (or higher) inverter (i.e., 2x the continuous load).
The graph below shows the voltage measurements:
The red line is the voltage of the power drawn from the residence via a long extension cord measured at the workshop end. It sags under load because the cord is too thin.
The orange line is the voltage of a battery and inverter system we’re testing for a client in the workshop. It’s nice and stable because there’s only a short wire in between.
The two lines tracked closely when we plugged the battery into the residence’s system.
When the second A/C kicked in, the line sagged more due to the power drawn until the breaker tripped, and the red line dropped to zero.
What we learned: The load is too high for the cord, and we should replace it for safety and reliability.
The graph below shows the energy consumption measurements:
Total power consumption over 24 hours is (4.966 + 2.404) kWh. At $0.62/kWh, it's ~$4.50 daily.
By overlaying sunrise and sunset times on the graph, you can determine how much power you use when solar panels aren’t producing power — that’s the battery capacity you’ll need.
Comparing the two lines, we can see how much power is used by appliances that run in the background. These may include Starlink, phone chargers left plugged in, TVs, and old fridges humming in the garage.
As part of our service packages, we interpret your usage pattern and help you make informed decisions. For example, you may lower your battery capacity requirement by changing your consumption pattern (e.g., running the well pump or boiler during the day). Or you may choose not to change a thing and invest in more battery capacity.
Buying more batteries costs more. But making tradeoffs also involves some costs (e.g., the inconvenience of flipping a few switches). Only you can decide what makes the most sense for you.
Then, we dimension your system to support your decision.
This data-driven approach is different from how most solar installers scope their projects. They make a guess and give you whatever is on the shelf — often grossly over-dimensioning the system to avoid trouble while leaving many optimization opportunities on the table.


