The Power of Data: How a Client Doubled His Solar Production in 30 Minutes
Ding! Our client Chris texted us one hot October day. His solar production dropped from the peak production of 1,400W in the summer to 700W. Is something wrong?
He sent us a screenshot of his solar charge controller (SCC) app, showing production at 736W. He also included a photo of his panel setup.
The panels were laid almost flat on the ground, optimized for summer yield. However, the sun angle has changed in the fall, and now the panels should tilt more to catch more available solar energy.
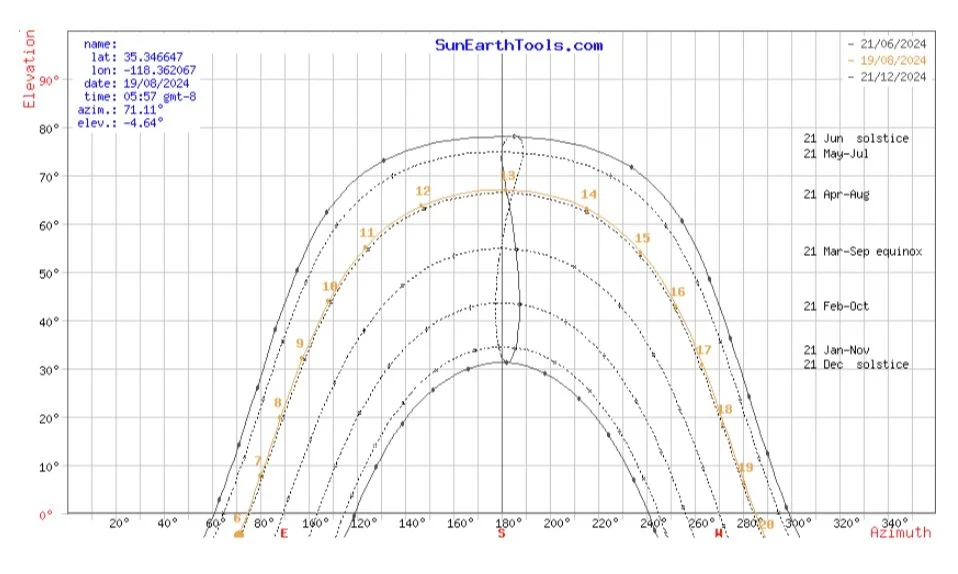
We’ve calculated the solar trajectory specifically for his property. We referenced the chart we produced and told him to aim the panels at 187 degrees from the north and tilt them at a 45-degree angle.
The solar production jumped to 1109W.
(Chris won’t need to go through the trouble of adjusting the panel angle to squeeze every last drop when he completes phase 2 of the project, adding 16 panels to the current array of 8. Here’s why we recommend over-dimensioning on solar.)
So, where’s the last 300W? Let’s do some diagnostics.
Chris’ system consists of two strings wired in parallel. We asked him to flip one circuit breaker and measure the production. Then, we told him to flip the other one and measure again.
One string produced 700W, while the other generated 400W — we’ve narrowed down the issue!
Thanks to data insights, we could deduce the problem and make immediate improvements without scheduling a visit. We also narrowed down potential issues to make on-site repairs more efficient.
Our SCC brand of choice comes with a smartphone app, and we put a robust battery management system (BMS) — also with a smartphone app — on top of all our custom-built battery solutions. These apps collect real-time data on the system's performance, allowing us to derive insights and make informed decisions.


